2021 activities statistics

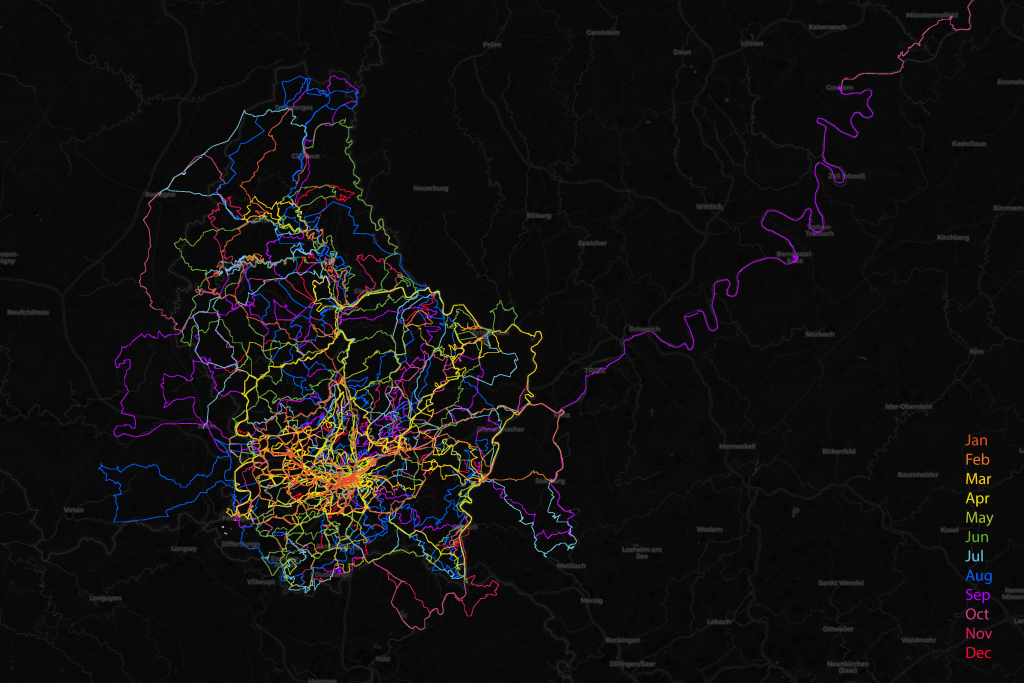
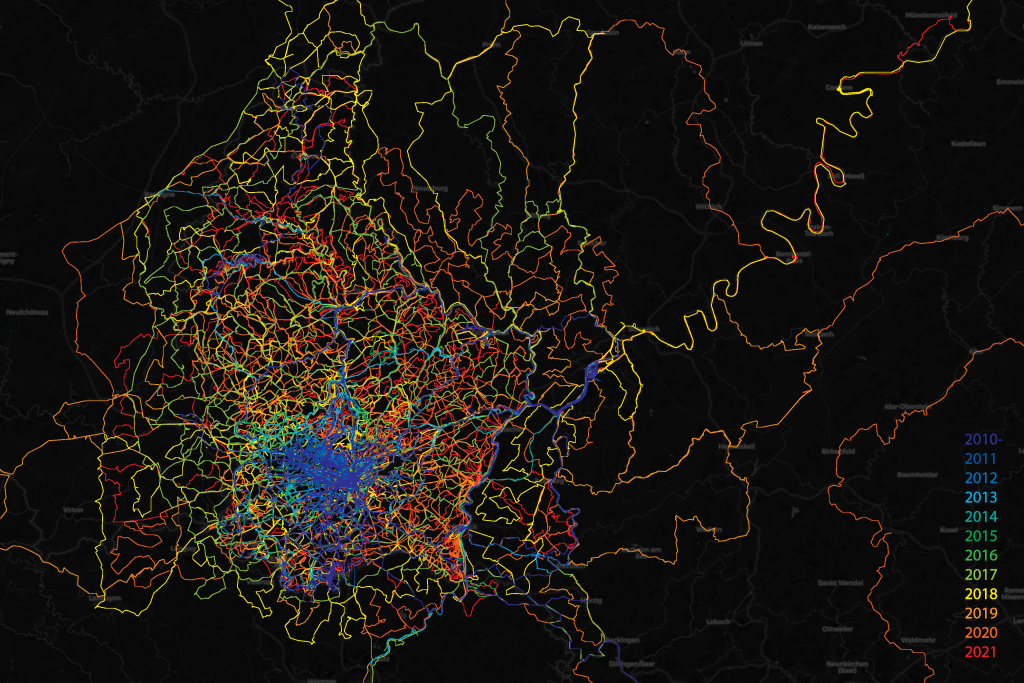
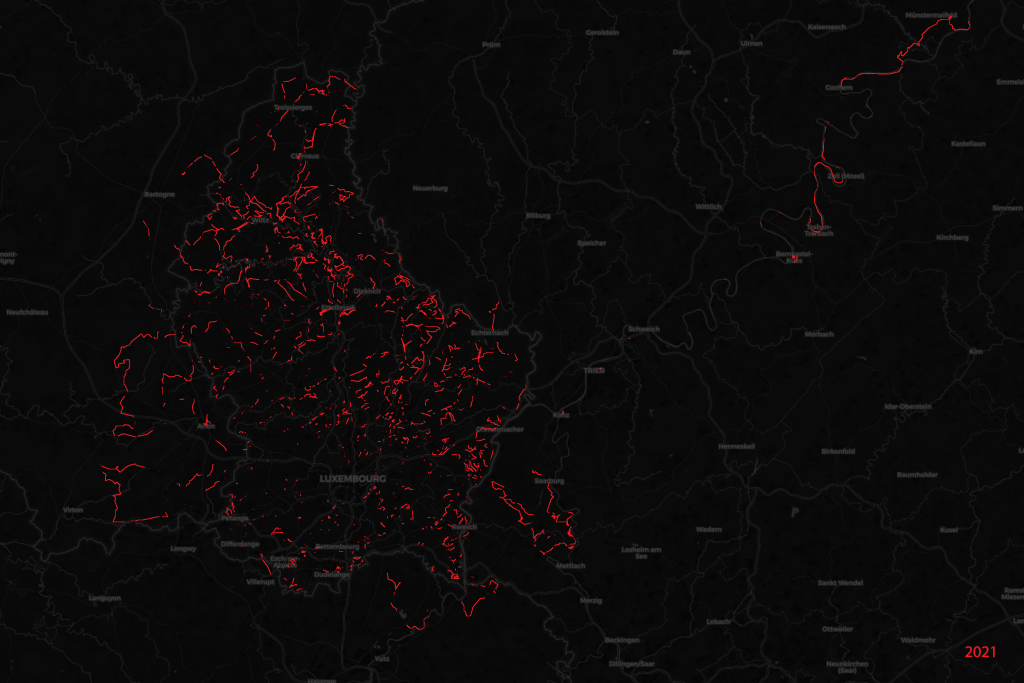
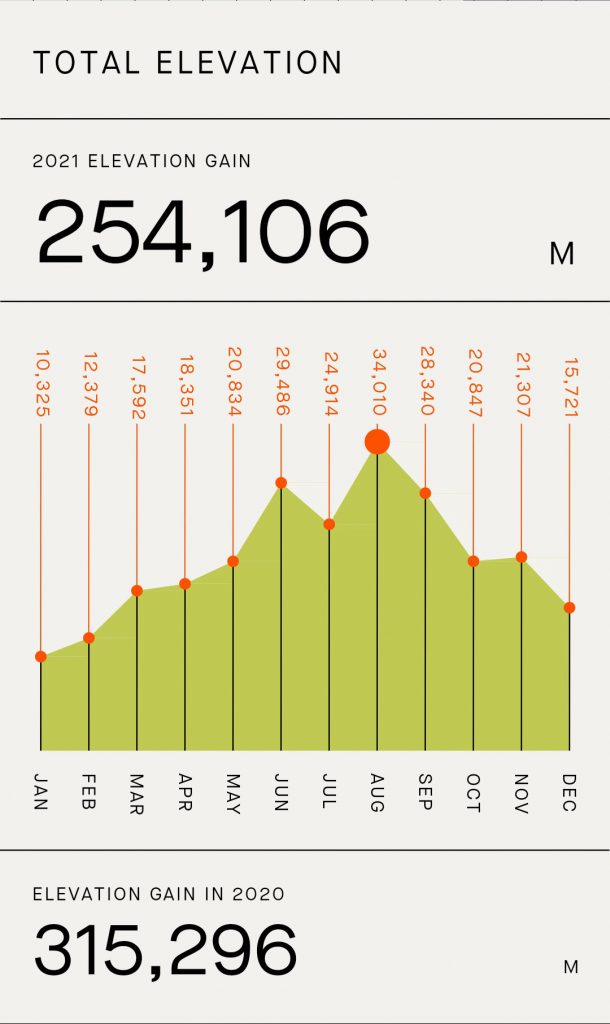
There aren’t as many activities as in 2020, but between my winter crash, no lockdown that allowed me to ride 4,000 km and a bad weather during summer, that could have been worse. VeloViewer infographic.
Here’s the map of the places I’ve been (near home) in 2021. The oldest month wins the colour. Extraction from StatsHunters map.
And the map of the last years (anything from 2010 and before is merged into the same colour), where you can see the new visited places over the years.
And finally a map of the newly discovered places in 2021. There’s a total of 1771.42 new kilometres according to wandrer.earth.
Nevertheless I managed to beat my longest distance in one ride on August 15.
Last infographic is about the cumulated monthly climbed distance; no wonder why my brakes, cassettes and chains are getting worn out quite quickly 😂

Each season in one picture:

Winter:

Hut
Hut (January 2, 2021)

Spring:

Aussichtsfelsen Ernzen
Aussichtsfelsen Ernzen (June 14, 2021)

Summer:

Sunset at Gringlee
Sunset at Gringlee (August 15, 2021)

Autumn:

Dusk fog in Äischdall
Dusk fog in Äischdall (November 7, 2021)

And a picture of the Runschelt viewpoint in different moments:

Chillout
Chillout (February 13, 2021)

Runschelt viewpoint
Runschelt viewpoint (May 23, 2021)

Runschelt viewpoint
Runschelt viewpoint (September 25, 2021)

Runschelt viewpoint
Runschelt viewpoint (November 14, 2021)


All the other pictures taken in 2021 are available here (warning: there are 3000’s of them!). And most activities are on my Strava feed.

Leave a Reply

Your email address will not be published. Required fields are marked *

This site uses Akismet to reduce spam. Learn how your comment data is processed.