Tag Archives: map

GoGoVELO

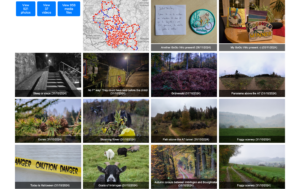
Short on time for reading? Dive into the pictures instead!

What is GoGoVELO?

GoGoVELO is a cycling campaign initiative brought to you by ProVelo and Climate Alliance Luxembourg, which takes over from MVOS (Mam Vëlo op d’Schaff/Schoul) and Tour du Duerf with the support of the Ministry of Mobility and Public Works. The first campaign ran from September 20 to October 31 under the theme “Around the world in 42 days“, intending to encourage everyone to “use the bike as often as possible as a means of transport in daily life.” To join in, install the “Radbonus II” app and you could win some great prizes! Fun moment: I happened to be visiting ProVelo when they registered the domain name gogovelo.lu.

I didn’t end up winning anything during the challenge, even though I came in at number 2 out of 562 (I’ve heard some buzz that number one is diving into some intensive training to prepare for the famous Race Across America!). Kind of reminds me of The Transcontinental Race where the winner only walks away with a handshake! Still, some friends who cycled a bit less than me and managed to win something surprised me with some lovely gifts 🎁😍.

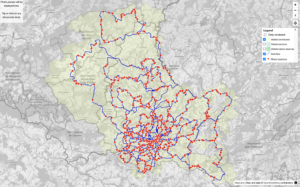
This week, they shared a heatmap showing where the challengers went cycling, but it seems my traces barely made a mark — looks like I’m the only one who enjoyed playing in the mud over in the Ardennes! 🐷

Media

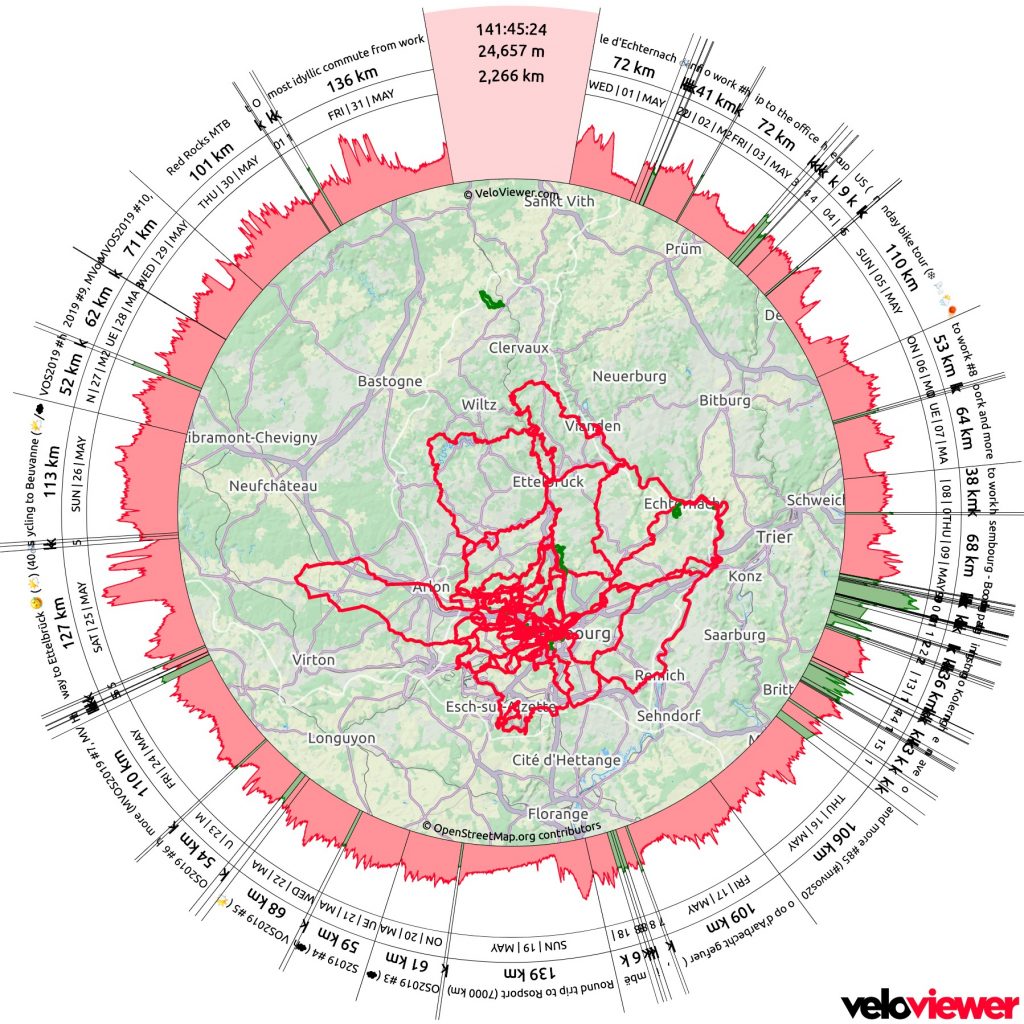
I put together a media gallery featuring photos and videos from the campaign, along with its map. Just a quick note: the distance shown on the map doesn’t match the statistics below since it includes walks but leaves out tunnels (no GPS signal there). Just click or tap on any picture below to get there.

GoGoVëlo map screenshot that shows the photo locations, activity lines and the visited communes.
GoGoVëlo gallery screenshot that shows a filter, a mini map and a preview of the photos and video taken.

Statistics

Overall

  • Total distance: 157,353.82 km (≈ 3.93 round-the-world trips)
  • Total calories: 3,933,845.48 kcal (based on 25 kcal/km)
  • CO₂ savings: 22,658.95 kg

My numbers

  • Total bike rides: 57, active days: 42, distance: 3,111.4 km
  • Total calories burned: 72,296.8 kcal (that’s a lot of pizza slices!)
  • Total elevation gain: 37,438 m (≈ 4.2 times Mount Everest)
  • Total commutes: 16 (190 km)
  • Most active day: Sunday with a total distance of 550 km and an elevation gain of 8,112 m
  • Distance and (elevation) by type of rides:
    • Gravel ride: 2,640 km (32,904 m),
    • Generic ride (on fully paved surface): 468 km (4,502 m),
    • E-bike: 3 km (32 m) 😂.
  • Eddington number (learn more about this):
    • Eddington number (miles): I rode at least 32 miles during 32 days,
    • Eddington number (km): I rode at least 39 km during 39 days.
    • The maximum Eddington possible number during this time period is 42 (whether km or miles)
  • Tiles: I visited 910 unique VeloViewer tiles, out of which 49 were new to me.
  • Average heart-rate: 116.9 bpm.
  • Visited countries: 4; number of activities in each:
    • Luxembourg: 57,
    • Belgium: 14,
    • France: 7,
    • Germany: 7.
  • Gear statistics: distance and (elevation):
    • Sequoia (fully equipped gravel bike): 2,334 km (27,277 m),
    • Citrus (light gravel bike): 606 km (8,460 m),
    • WorldTraveller (trekking bike): 169 km (1,669 m),
    • Vel’Oh (city e-bike): 3 km (32 m) 😂.
  • Weather statistics:
    • Temperature:
      • coldest: October 13 (min. 3℃, avg. 9℃), in a ride named “West hook with a few new tiles (⛅🌤️🌬️🥶)” – 168 km
      • warmest:  September 21 (avg. 22℃), in a ride named “Sauer & Oesling wonderland (☀️)” – 69 km, but parts of the ride on October 21 had some warmer temperature peaks (Saar autumn vibes with summer weather! (🌞; 22,000 km ✔️) – 117 km)
      • average: calculating the average temperature really wouldn’t be meaningful since the average of each ride’s temperature isn’t accurate with all the different distances and duration involved—and honestly, I’m just not motivated to extract each second’s temperature from my raw data.
      • maximum:  publishing the maximum temperature wouldn’t make much sense either, as it’s usually just the bike’s temperature when I kick off my ride or when the temperature probe has been sitting in the sun for a while.
  • Riding costs (based on the price of the bikes, the maintenance and replaced parts – excluding accessories, food and drink supplies):
    • Sequoia:  197.07 EUR – method: I spend (at least) 7900 EUR on this bike and travelled 93,564 km on it (≈ 8.4 cents/km)
    • Citrus: 83.48 EUR
    • WorldTraveller: 13.05 EUR
    • Vel’Oh: 5 cents (one day of the yearly subscription cost to the service)
    • Total: 293.65 EUR (or 9.4 cents/km, which doesn’t include food supplies)
      I used StatsHunters which has a Gear section where you can input your bike cost and maintenance fees.
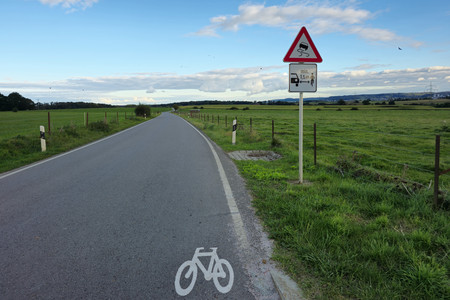
  • Close pass: only one, but located just 200 m after a newly installed sign “minimum 1.5 m lateral distance when overtaking a bike” as displayed on the photo below.

Radbonus II app review

Pros

  • It’s a small company, so when you open a ticket, you’re chatting directly with the engineer, which really helps you appreciate the pressure they’re under when something goes wrong. They shared some fascinating insights with me, like Kalman filters and the challenges of Android development with all that varied hardware.
  • When there was an issue with the app, I could easily share the link to my activity, and they were able to manually import it.

Cons

  • I found the app’s FAQ a bit misleading when it suggests connecting to Google Fit, as that feature isn’t actually implemented. Just as a side note, I noticed that Google Fit only managed to capture about 5% of my Strava activities, so I ended up moving away from it altogether.

  • It can be tricky to remember to start the app alongside the GPS and speed sensor (which is right in front of you) when kicking off a ride—I often recall it after riding for a few kilometres!

  • The Radbonus II app’s internal logging seems to use algorithms that smooth out poor GPS signals, which is why the distance recorded is typically less than what my Garmin shows (averaging about 5 km less each day). The discrepancy in my distance readings decreased a bit since it recorded some walks I forgot to stop, but that didn’t quite close the gap between Radbonus (3054 km) and Garmin (3111 km).

  • While the iPhone app can sync to Health for activity tracking, the Android version doesn’t have that feature. I’ve noticed that the Android logs less distance than the iPhone via Health, which feels a bit unfair for users with a Garmin on an Android phone compared to those using Apple, who can sync their data seamlessly through Apple Health. It would have been great to directly upload a FIT file from a GPS device to the platform, even better for me with a web API call so I could automate the upload when doing the processing of my daily photos.

Room for improvement

It would have been great to have some social events where people could come together to share their experiences and enjoy the scenery, allowing avid participants to connect. Promoting dedicated hashtags on social networks could also have helped build a sense of community. I know that’s easier said than done, especially since ProVelo and Climate Action Luxembourg are small teams, but perhaps companies, public administrations, and local communes could have played a role in initiating the social aspect. Optional small giveaway gifts to promote the action are also a great idea, just like MVOS did. An alternative could be to host a gathering of like-minded individuals; for instance, I would welcome the opportunity to connect with some of my “competitors“.

2023 outdoors statistics

If you don’t want to read the text and see the captivating pictures, they’re right there for you to explore. Choose between my monthly selection of images or the daily ones, which are mostly untitled.

It’s crazy that I haven’t contributed a single post to this platform in the past two years! But fear not, my dear audience, for I shall grace you with some information about my fascinating outdoor escapades in the magnificent year of 2023.

Oh boy, what a year it was! I mean, talk about numbers and achievements galore! Get this, I logged a 200,000 km on total rides Strava. Yeah, that’s right, TWO HUNDRED THOUSAND! And hold on tight, because I also conquered a jaw-dropping 2 million meters of elevation gain. I practically climbed Mount Everest twice! But wait, there’s more, I made my 100th-century ride during the summer season. 

Oh, and let’s not forget about my thrilling adventure in the world of PostGIS queries. Because, you know, who doesn’t love a good old data hunt?  It turns out that I uncovered a hidden gem of a village in Luxembourg called Dorscheid. How dare it elude my travel radar for so long! And wait for it… I also discovered a mythical section known as Leidenbach. It’s so elusive that its area measures a whopping 0.5 square kilometres.

All in all, I can proudly say that I’ve conquered the world of numbers and geographical mysteries.

Figures for 2023 provided by Veloviewer:

VeloViewer infographic for 2023

Another year of mediocre cycling accomplishments. Who needs to beat their total distance, max ride distance, max ride elevation, or number of centuries when they can proudly announce that they’ve surpassed their record of elevation gain in the groundbreaking year of 2023? Also,  I managed to avoid getting even a flat tyre while riding, but I replaced three wheels! 

Below, you will find the picture of the activity map near Luxembourg for 2023. 

2023 activity map near Luxembourg

According to wandrer.earth, I got 3201.83 new unique kilometres, and the Squadrats progress is shown below.

Squadrats yard (equivalent to VeloViewer's tiles)
Squadrats yardinho (like VeloViewer's tiles, but 64 times more dense)

PostGIS query to display visited municipalities during 2023

I’ve had the absolute pleasure of gracing all the Luxembourg communes with my presence countless times. And hey, let’s not forget the excitement of venturing across the border to explore all the juicy municipalities on the other side. Well, except for dear old Mont Saint-Martin.

The absolute highlight was on the scorching day of July 11, when the heat was hardly bearable, with scorching heat and suffocating humidity! And of course, to balance things out, we had the pleasure of experiencing the bone-chilling cold on August 31, with a freezing shower that almost turned me into an ice sculpture! I couldn’t help but shiver aaaall the way back home.

Oh, just a tiny little thing I managed to accomplish… I mean, it’s not like it’s a big deal or anything, but I casually hopped on my bike one day and conquered all the highest peaks in each of the Benelux countries. Who needs a car or a helicopter when you can pedal your way to the top?

Oh, I had grand plans to merge my two biggest VeloViewer clusters! But alas, I failed miserably to even reach Saarbrucken, let alone Sarreguemines. As for expanding my biggest square to encompass all of Luxembourg, I managed to tick off a few tiny corners, so that’s something,

Now, as I ponder the upcoming year, I must confess I haven’t bothered solidifying any goals just yet. I mean, who needs goals when there are countless ideas just waiting to sprout like beautiful flowers in the warm embrace of longer days?

End of May statistics

VeloViewer wheel for May 2019

And some missing pictures from the end of May while transforming commutes to work into a daily adventure.

https://g.kewl.lu/picture/8706

https://g.kewl.lu/picture/8705

https://g.kewl.lu/picture/8704

https://g.kewl.lu/picture/8703

https://g.kewl.lu/picture/8702

https://g.kewl.lu/picture/8701

https://g.kewl.lu/picture/8699

https://g.kewl.lu/picture/8700

https://g.kewl.lu/picture/8698

https://g.kewl.lu/picture/8697

https://g.kewl.lu/picture/8696

https://g.kewl.lu/picture/8695

https://g.kewl.lu/picture/8693

https://g.kewl.lu/picture/8694

Sentiers des passeurs (Troisvierges)

https://www.strava.com/activities/2357012749

GPS track also available for download on GPSies.

Description in English or French.

https://g.kewl.lu/picture/10294

https://g.kewl.lu/picture/10291

https://g.kewl.lu/picture/10293

https://g.kewl.lu/picture/10292

https://g.kewl.lu/picture/10290

https://g.kewl.lu/picture/10289

https://g.kewl.lu/picture/10288

https://g.kewl.lu/picture/10287

https://g.kewl.lu/picture/10286

https://g.kewl.lu/picture/10283

https://g.kewl.lu/picture/10285

https://g.kewl.lu/picture/10284

https://g.kewl.lu/picture/10282

https://g.kewl.lu/picture/10281

https://g.kewl.lu/picture/10280

https://g.kewl.lu/picture/10279

https://g.kewl.lu/picture/10277

https://g.kewl.lu/picture/10278

https://g.kewl.lu/picture/10276

https://g.kewl.lu/picture/10275

https://g.kewl.lu/picture/10274

https://g.kewl.lu/picture/10273

https://g.kewl.lu/picture/10272

https://g.kewl.lu/picture/10271

https://g.kewl.lu/picture/10270

https://g.kewl.lu/picture/10269

https://g.kewl.lu/picture/10268

https://g.kewl.lu/picture/10267

https://g.kewl.lu/picture/10266

https://g.kewl.lu/picture/10265

https://g.kewl.lu/picture/10263

https://g.kewl.lu/picture/10264

https://g.kewl.lu/picture/10262

https://g.kewl.lu/picture/10260

https://g.kewl.lu/picture/10261

https://g.kewl.lu/picture/10258

https://g.kewl.lu/picture/10259

https://g.kewl.lu/picture/10257

https://g.kewl.lu/picture/10256

https://g.kewl.lu/picture/10255

https://g.kewl.lu/picture/10254

https://g.kewl.lu/picture/10253

https://g.kewl.lu/picture/10252

https://g.kewl.lu/picture/10251

https://g.kewl.lu/picture/10250

https://g.kewl.lu/picture/10249

https://g.kewl.lu/picture/10248

https://g.kewl.lu/picture/10247

Bike ride to wiltz

Simplified itinerary from Luxembourg City:
– follow PC 1 and PC 13 to Garnich,
– follow PC 12 to Hagen and Steinfort, stay and follow PC 12 (EuroVelo 5) to PC 17 in Noerdange,
– follow PC 17 to Koetchette (EuroVelo 5), and jump on PC 18 to Martelange,
– continue following EuroVelo 5 signs until cycling directions are provided to Bastogne; note that many parts are unpaved between Martelange and Bastogne,
– continue on the cycleways to Wiltz

Note that my map doesn’t follow this way to Steinfort as I stopped in my office.


https://g.kewl.lu/picture/8086

https://g.kewl.lu/picture/8085

https://g.kewl.lu/picture/8084

https://g.kewl.lu/picture/8082

https://g.kewl.lu/picture/8083

https://g.kewl.lu/picture/8081

https://g.kewl.lu/picture/8080

https://g.kewl.lu/picture/8079

https://g.kewl.lu/picture/8078

https://g.kewl.lu/picture/8077

https://g.kewl.lu/picture/8076

https://g.kewl.lu/picture/8075

https://g.kewl.lu/picture/8074

https://g.kewl.lu/picture/8073

https://g.kewl.lu/picture/8072

https://g.kewl.lu/picture/8071

https://g.kewl.lu/picture/8070

https://g.kewl.lu/picture/8069

https://g.kewl.lu/picture/8068

https://g.kewl.lu/picture/8067

https://g.kewl.lu/picture/8066

https://g.kewl.lu/picture/8065

https://g.kewl.lu/picture/8064

https://g.kewl.lu/picture/8063

https://g.kewl.lu/picture/8062

https://g.kewl.lu/picture/8061